Measuring the value of projects can get messy. Forecasting how much money a project is due to bring in—and keeping track of how much you’ve really earned once the work’s done—needs a systematic approach. Without one, you put your projects’ financial health in a risky position.
With project rates, you can easily understand the projected amount you’ll charge clients and compare that with the revenue you’ve earned after project delivery. This all helps you make more accurate projections, and gives you the data you need to analyze how you’re tracking against your project budgets.
Let’s take a look at how it all works, and what it means for your business.
In this article 📖
Set your team’s rates
When we talk about project rates, we’re referring specifically to the rates you charge to clients.
From Settings, you can populate your rate card and choose the currency you want to apply to all your rates. You can set multiple rates tiers, but only one rate can apply to each person in your account. Rest assured, only Admins and Managers can see the rates assigned to each person.
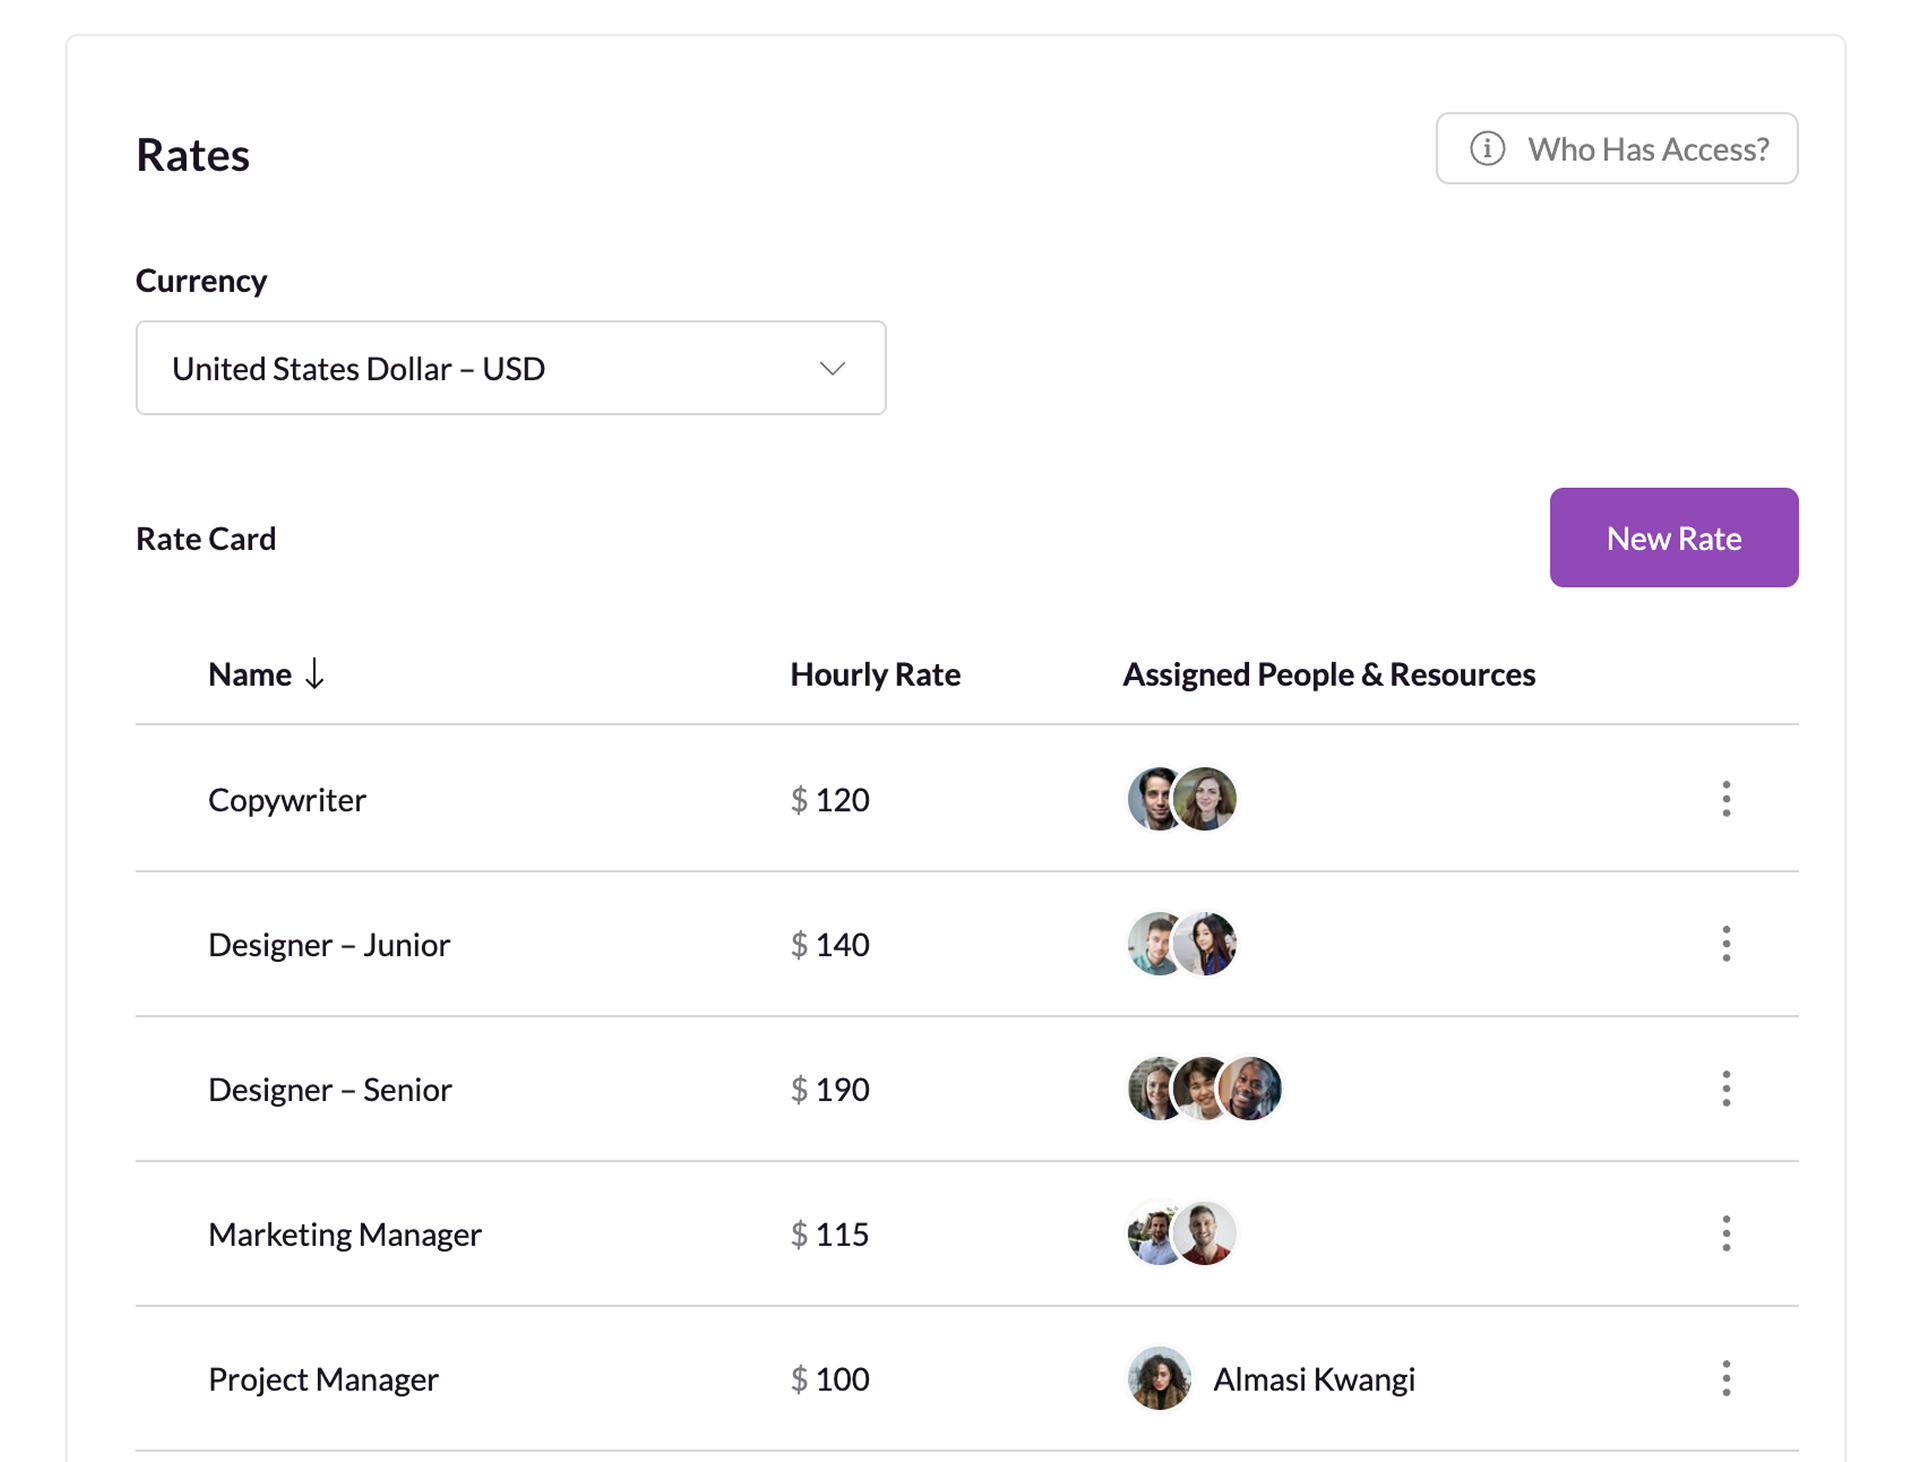
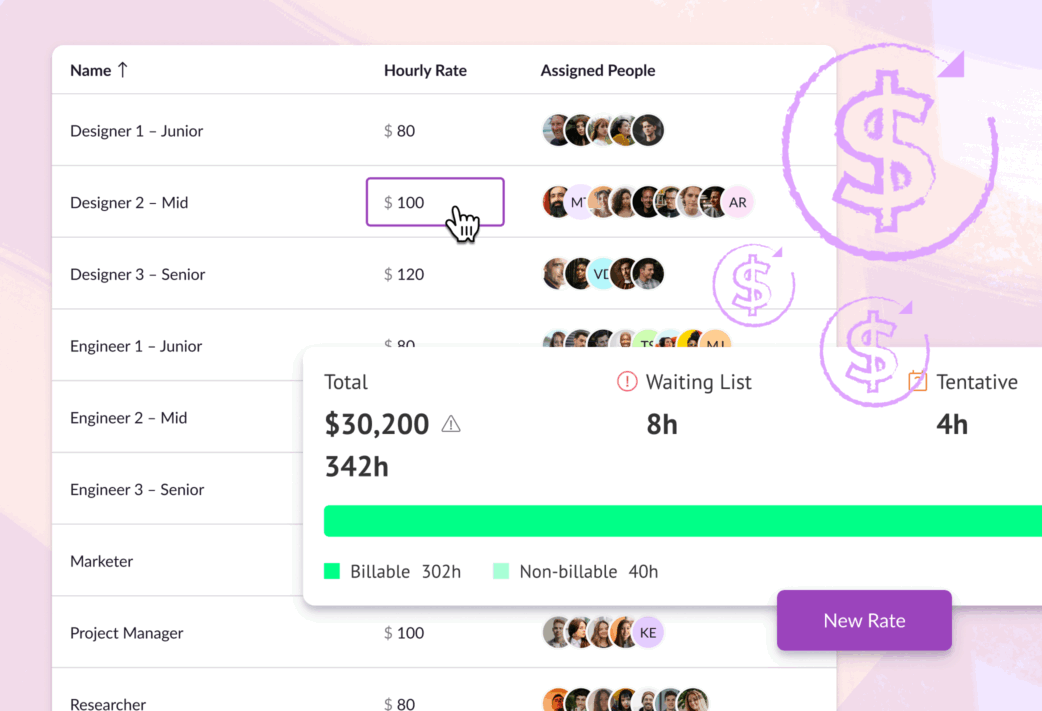
Here, we’ve added rates per role, and added different tiers within those roles. For example, we’ve added two tiers for designers, where junior designers have lower hourly rates, and senior designers have higher hourly rates. Then, we’ve assigned the relevant people to each tier.
Of course, you can fully personalize your rate card to fit your team’s specialities, and the exact rates you charge. Once you’ve created your rate card, you can assign rates to individuals on their profile card too.
The rates you set up in your rate card will apply by default to all future projects you create. But, for projects with bookings you’ve made before you set up the rate card, you’ll have to add rates manually, and make adjustments if you’re charging different amounts for work on those projects.
If your staff work at a day rate, you can take that rate and divide it by the total number of hours they work per day. Then, add that as their hourly rate in Resource Guru. You can also apply rates to vehicles, equipment, and meeting rooms if required.
Customize rates per project
As we’ve mentioned, rates get pulled from the rate card into new projects, but you can adjust them on a per-project basis too.
Navigate to the project team tab and you’ll see the rates of everyone assigned to that project. You can manually edit their hourly rates if you want to charge more or less for that specific project.
It’s inevitable that you’ll have to change rates from time to time, so there are safeguards in place to keep data about work you’ve already completed accurate. This is because changes to rates affect reporting, timesheets, and billing.
To revert customized project rates to what’s listed in your rate card, simply open the mini-menu next to a person or resource’s name and select “Apply Current Rate”.
If you’re new to Resource Guru, you can explore all the features we’ve mentioned so far—and a lot more—with a 30-day free trial:

The #1 scheduling tool trusted by thousands of project teams
Join thousands of project managers who have made scheduling a breeze.
Analyze upcoming revenue
Resource Guru reports already help you manage and analyze factors like billable versus non-billable utilization, but project rates take that data’s impact up a notch.
You need to track the billable value of scheduled work to understand if the projects in your pipeline will generate the revenue you need. From the project view in reports, you can get a sense of how much money your business is going to bring in from the projects you’ve already added bookings to. This is based on their scheduled billable time.
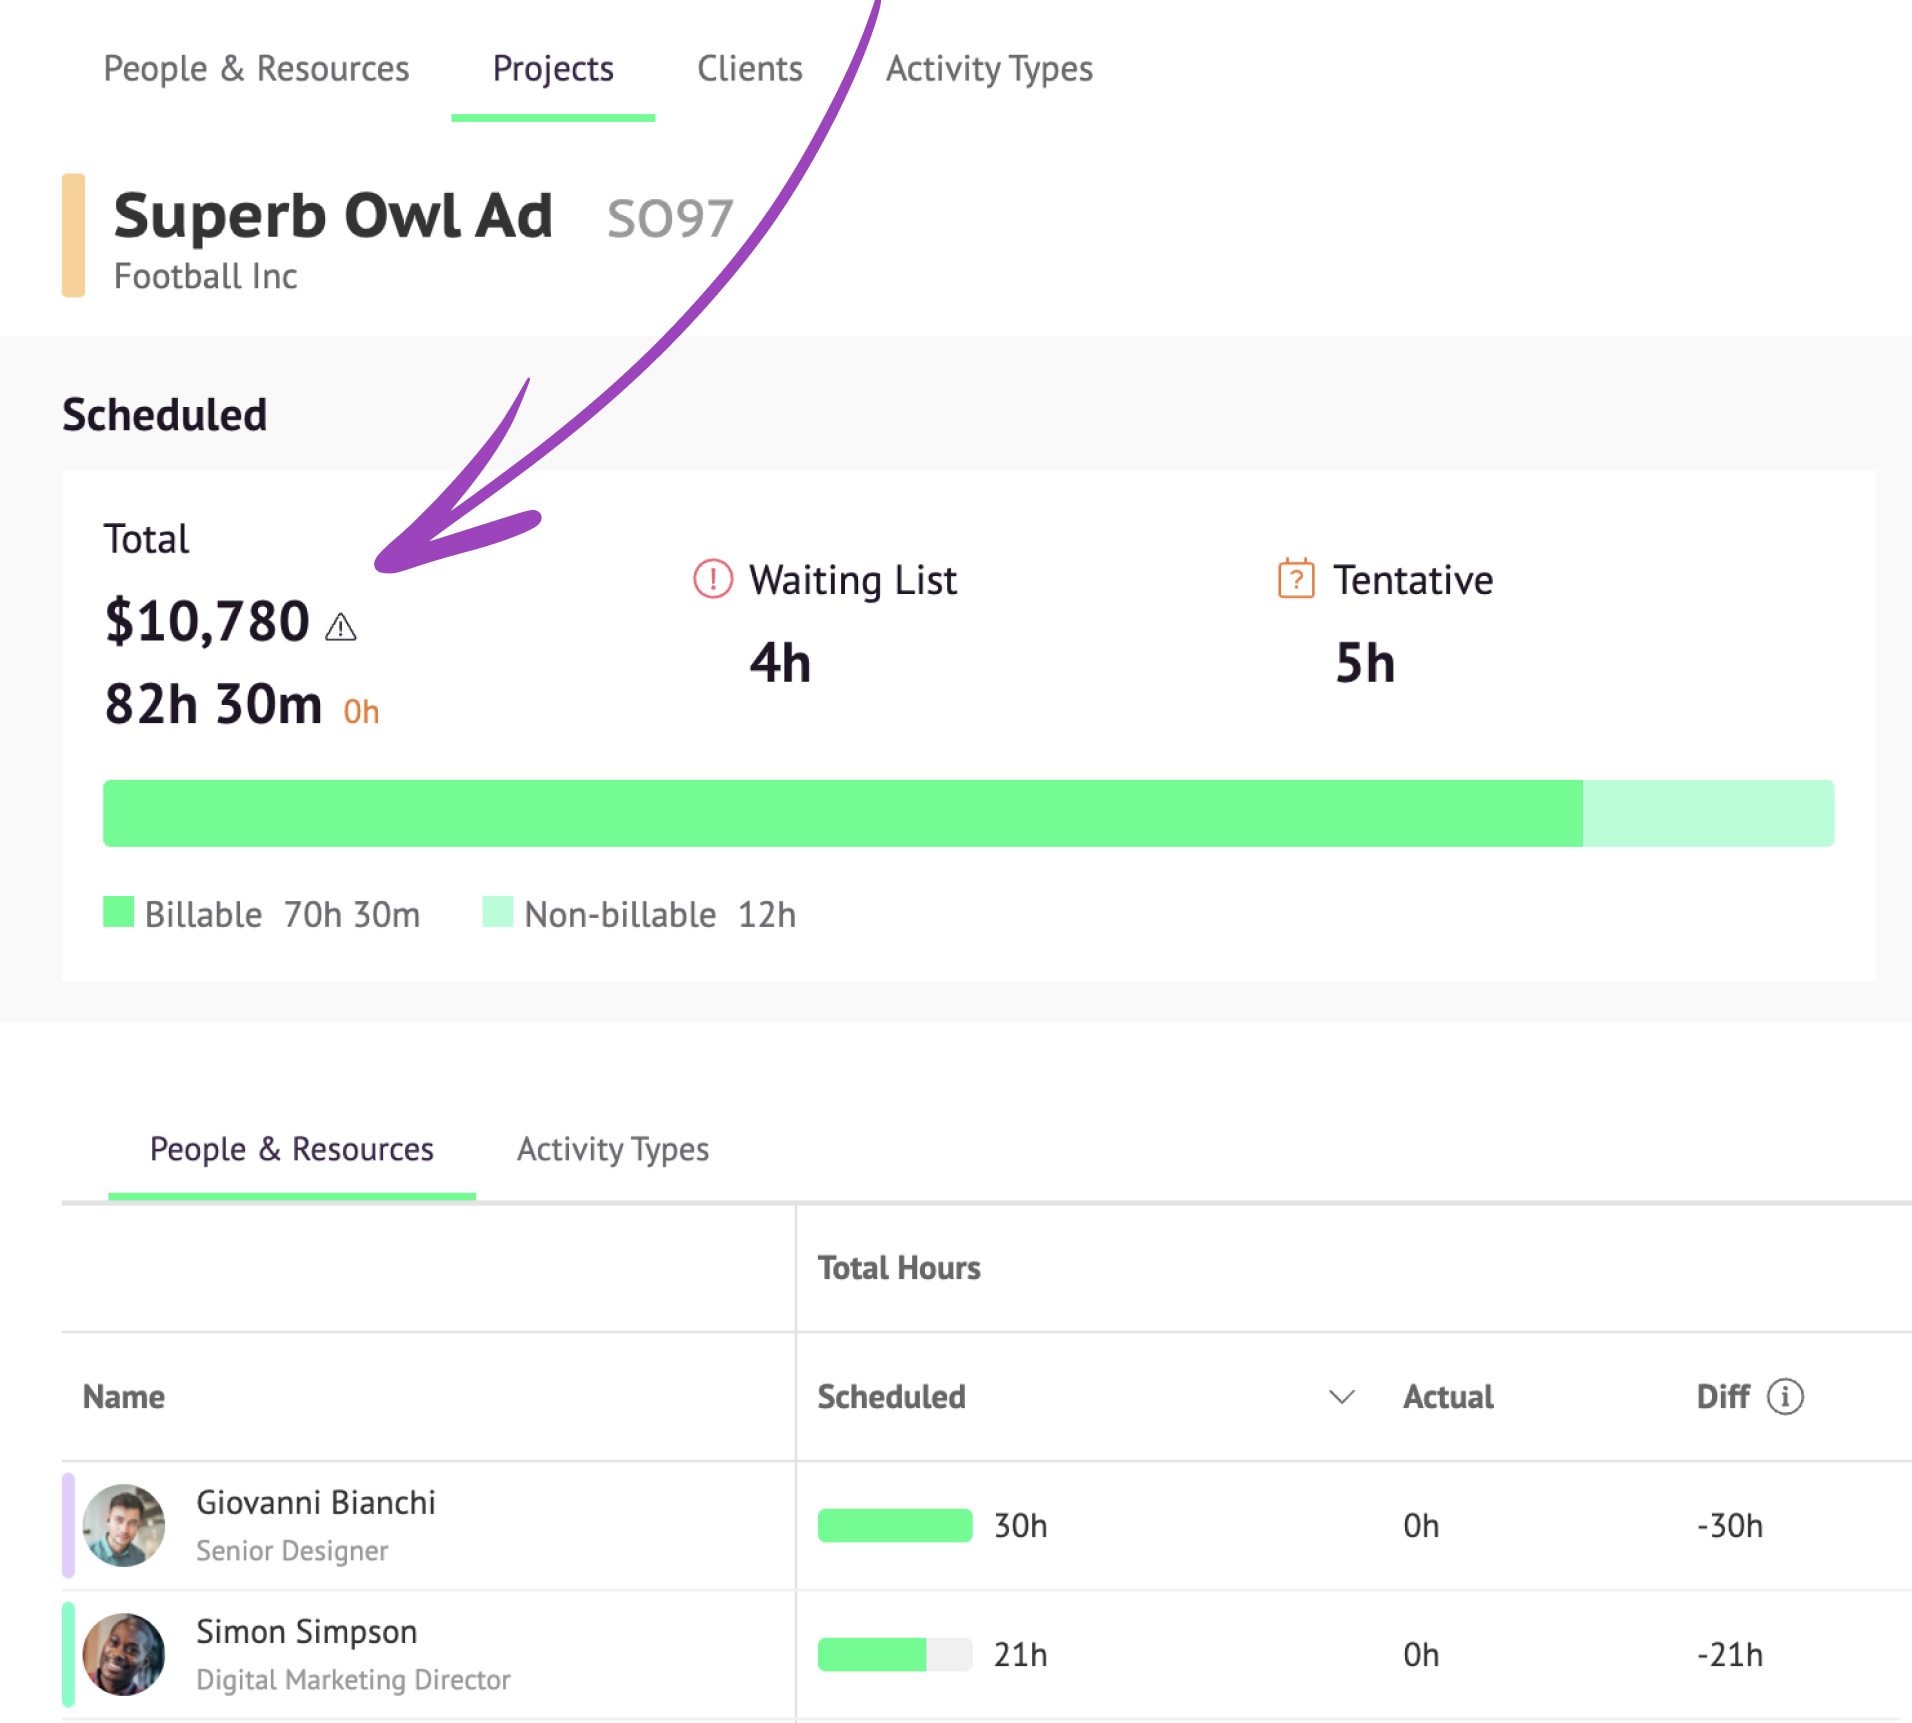
Here, you’ll see the total amount of money that’s set to be billed to the client for this project, as well as how many hours that equates to. You’ll also get a visual showing the proportion of your team’s scheduled time that is billable, versus the amount that’s non-billable.
You can filter by timeframe to break this down further and get a more detailed understanding of the revenue you’re earning across a given time period.
With that information, you can make sure your finances are looking healthy, understand which projects are due to be the most lucrative, and assess any gaps you might need to fill with new business. As a bonus, you can use these figures to inform your purchase orders and invoices.
Compare expected and billable revenue
To take this one step further, you can compare forecasted revenue and billable revenue by enabling timesheets, if you haven’t already.
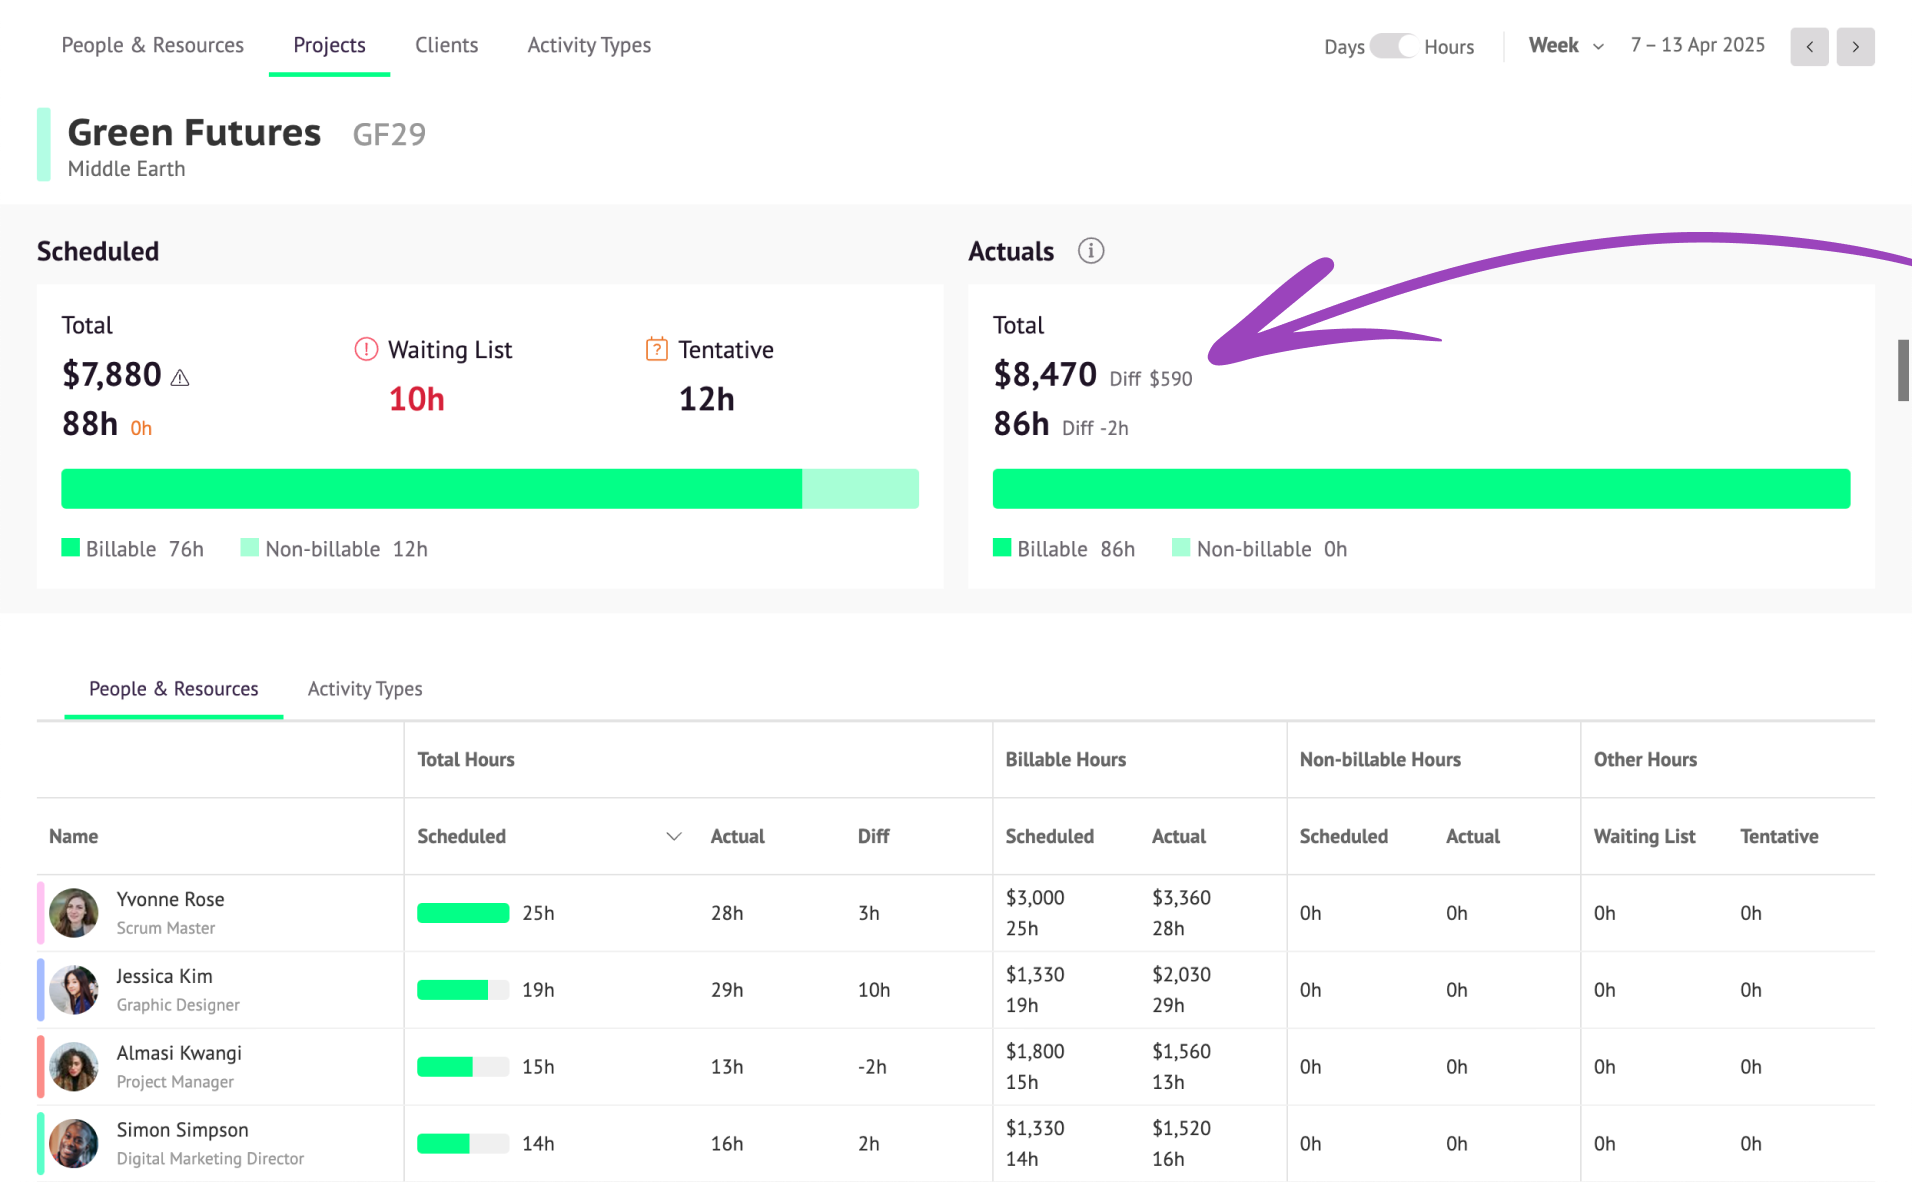
Once that’s set up and your team has logged their entries, you’ll see a side-by-side comparison of the hours your team expected to work on projects, versus the actual hours spent.
Alongside that, you’ll see a calculation of the revenue associated with that work, both in terms of what was forecasted, and in terms of billable revenue based on actuals. This helps you avoid over-servicing clients without realizing, making sure your project’s worth what you expected.
Using this information, you can understand how accurate your projections are and pivot if you need to, to make up for any discrepancies. Whether you’re burning more or less budget than you expected, you’ll have the data you need to make improved predictions and forecasts for upcoming projects.
Explore the full power of project rates
Project rates are available on Blackbelt and Master plans. For a deeper dive into all they can do for you, check out our Help Center.
Explore upcoming releases you can use in combination with project rates, including project budgets and placeholders, in our Product Portal 👇
What’s next for Resource Guru?
Explore our product portal to see what’s planned next and what we’ve already added. Vote on which features are most important to you and submit new ideas to have your say!


