Great project managers all share a superpower: they can bring order to chaos. But, there are a few crucial things they need to pull it off. They need to be able to visualize and manage workloads—fast. And, they need to be able to address capacity issues that threaten the project’s progress—even faster.
Looking for a secret weapon that can help on both fronts? Say hello to heatmap views.
In this article 📖
A different perspective on availability
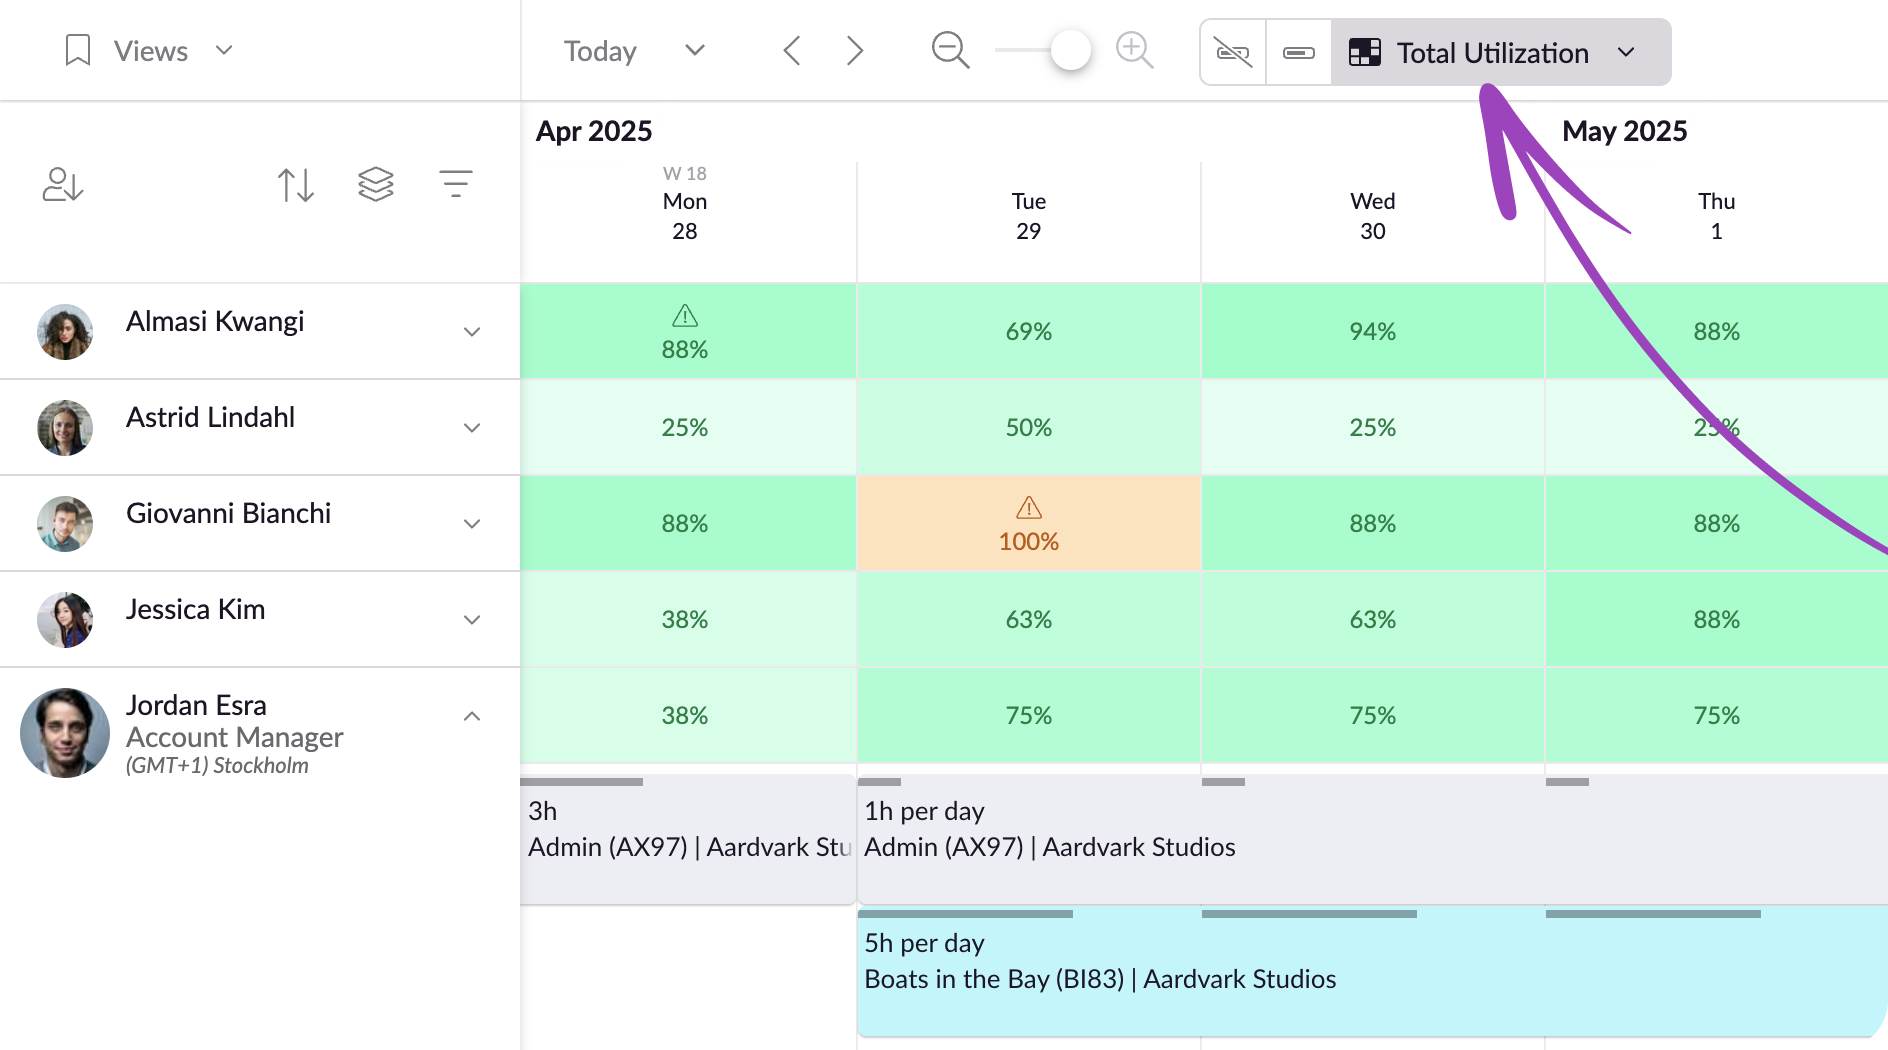
When you’re managing large teams and larger workloads, spotting capacity issues can get tricky. A heatmap view helps because it uses color coding to represent different workload intensities.
A darker green and a high percentage on the Schedule means a heavier workload. A lighter green with a lower percentage means a lighter workload. Amber spots on the heatmap view highlight workloads you might need to adjust—more on that later.
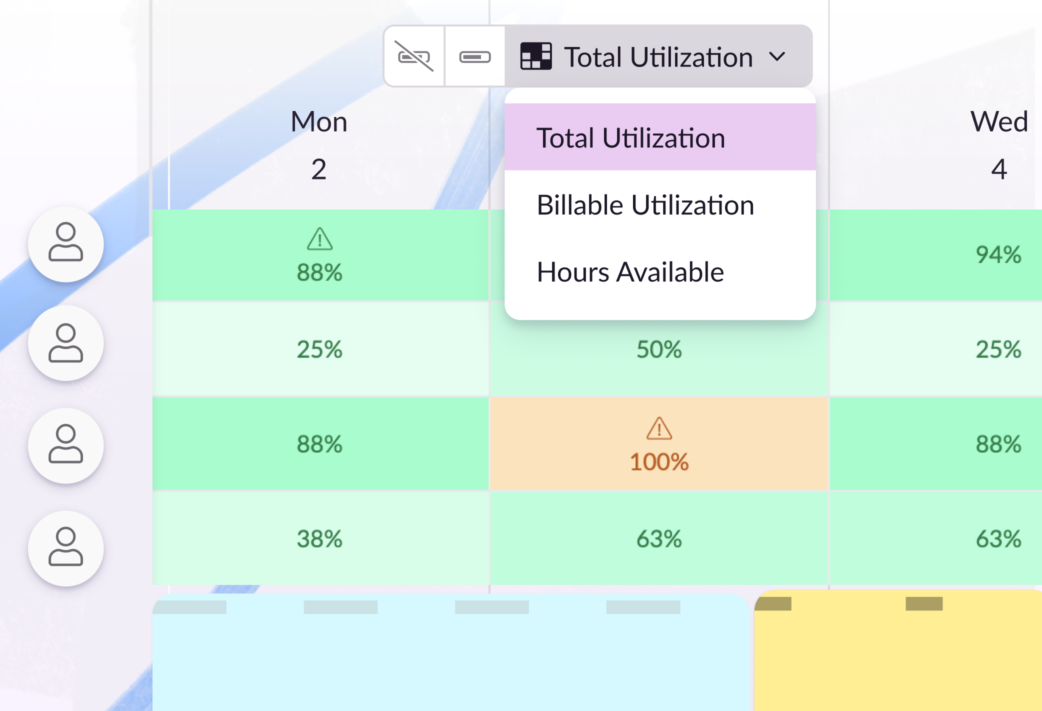
You can enable a heatmap view at the top of the Schedule. There are three options to choose from:
- Total Utilization
- Billable Utilization
- Hours Available
Once active, heatmap views make the Schedule extremely scannable, letting you understand utilization and availability at a glance.
You can then click on any of the heatmap rows to expand someone’s schedule and create or edit bookings as usual.
Pro tip
By zooming out on the Schedule with a heatmap view enabled, you can switch from seeing the totals per day, to the totals per week.
Spot bottlenecks in an instant
The total utilization heatmap view shows what percentage of a person’s availability is booked. Most people aim for around 80% total utilization. This heatmap view lets you quickly identify folks who fall outside those parameters.
You can use the low total utilization indication on the heatmap view to find individuals who are available for tasks where you need more people power. On the flip side, you can scan for high total utilization to shuffle responsibilities for people who need a breather.
Resource Guru heatmap views flag when there are issues like this.
Specifically, you’ll see a warning icon on a green background when someone has bookings that require attention. For example, if they have bookings on the Waiting List, or if external events are clashing with what’s in their schedule.
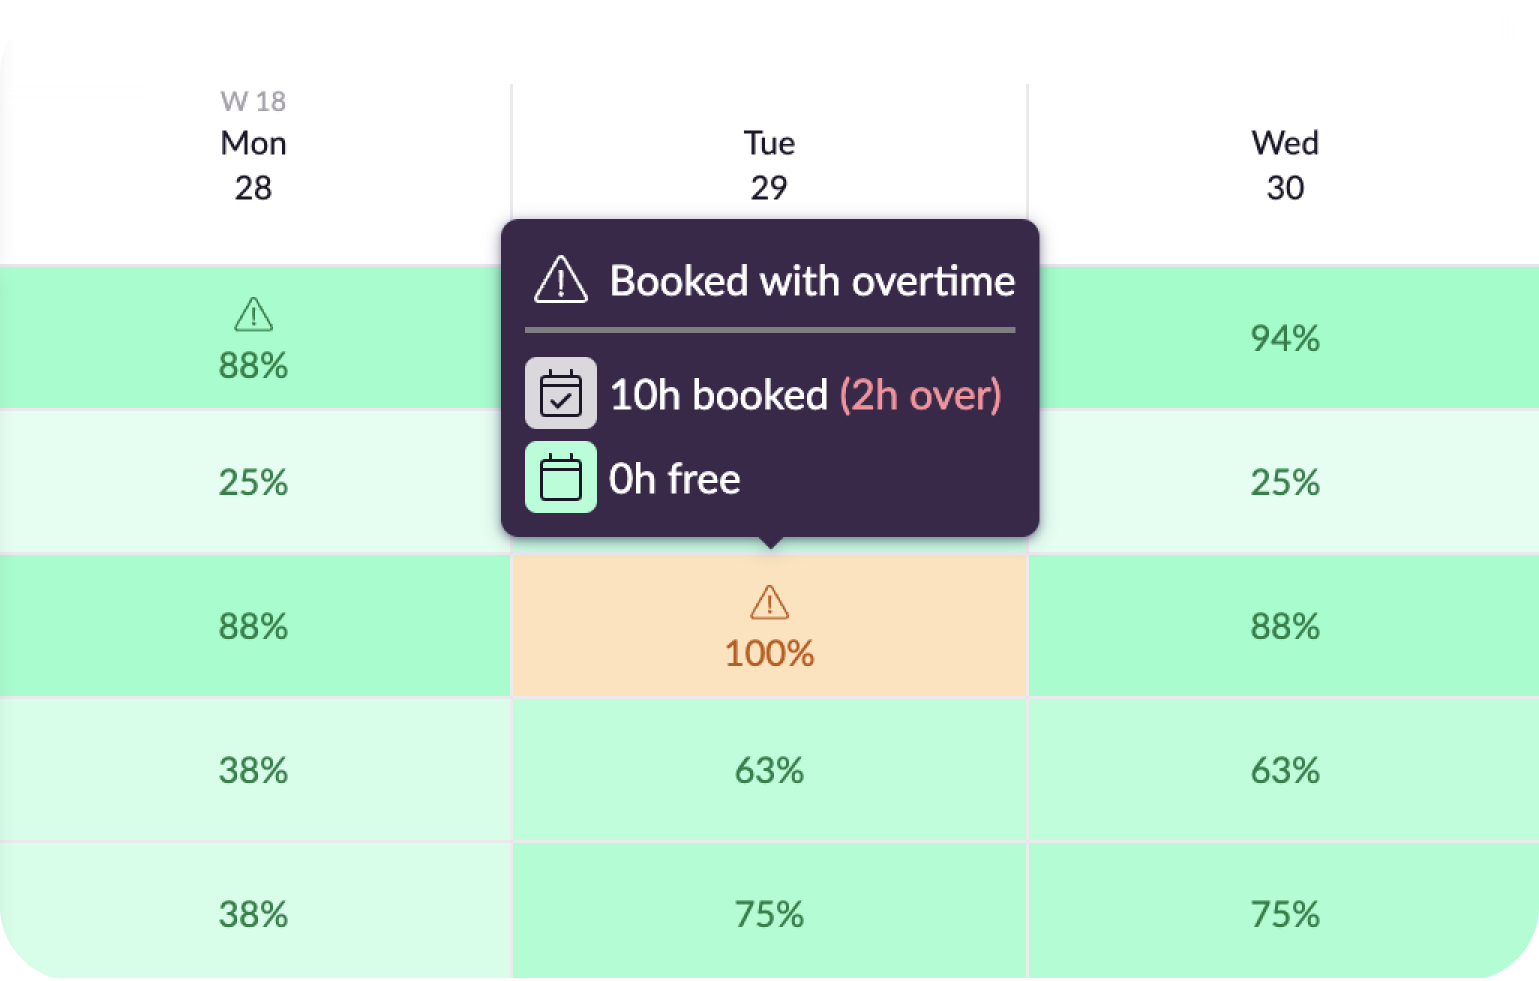
And, if someone is booked beyond their normal availability, i.e. if they’re working overtime, you’ll see an amber color with a warning icon.
This heatmap view lets you identify these issues quickly, so you can act on overwhelming workloads before burnout strikes, and stop crises in their tracks.
Uncover revenue opportunities
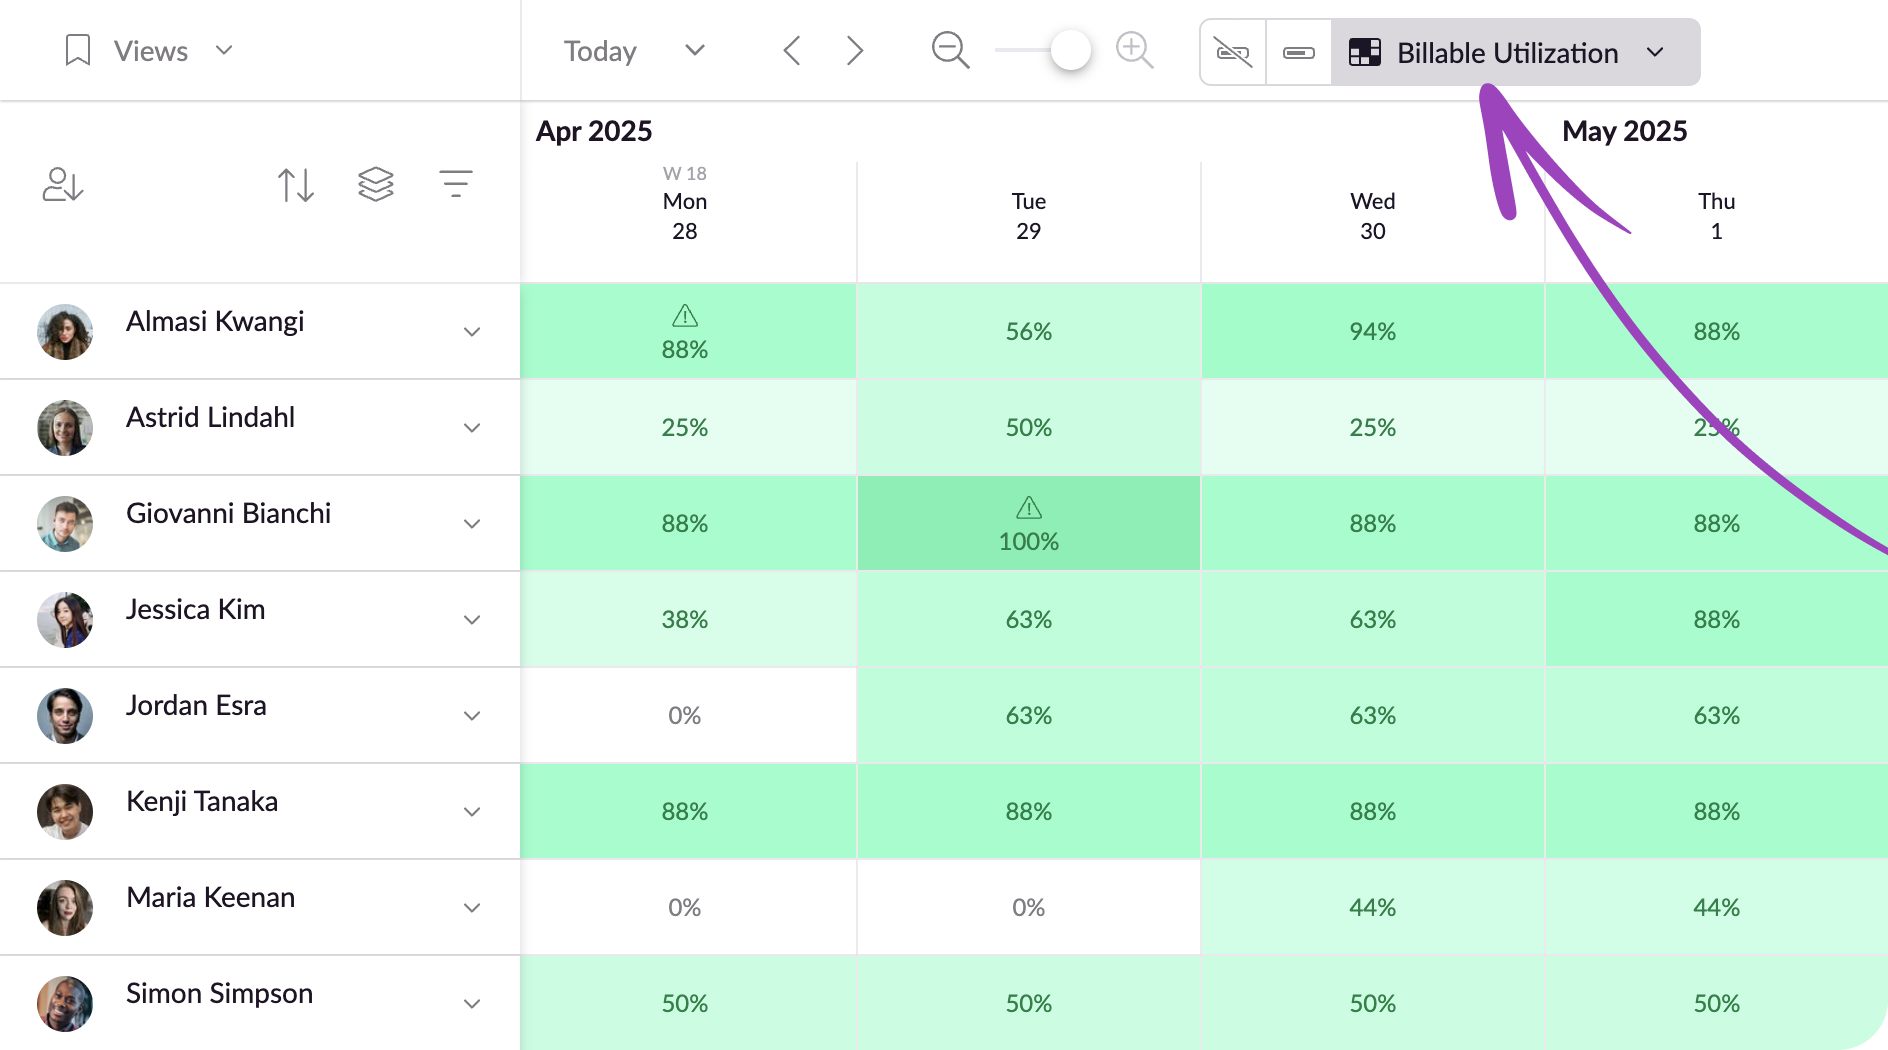
The billable utilization heatmap view works in a similar way to the total utilization view. Activate it to uncover how much of their time each person spends on billable work.
What is billable utilization?
Billable utilization is the percentage of work hours spent on billable work by an individual.
This metric represents exactly how much time your people spend on work that generates revenue. It can help you assess and analyze the overall performance and health of your business.
Billable work includes tasks and activities that can be directly charged to a client, and they directly impact revenue.
Non-billable work cannot be charged to a client and includes things such as admin, business development, internal meetings, and training.
With the billable utilization heatmap view, you can spot where people are spending too much time on non-billable work, faster than ever. This lets you see who in your organization has space to generate more revenue for the business, giving you a bird’s eye view of how you can increase the company’s bottom line.
Find the time for pressing tasks
Need another way to dissect your team’s availability? Just use the hours available heatmap view.
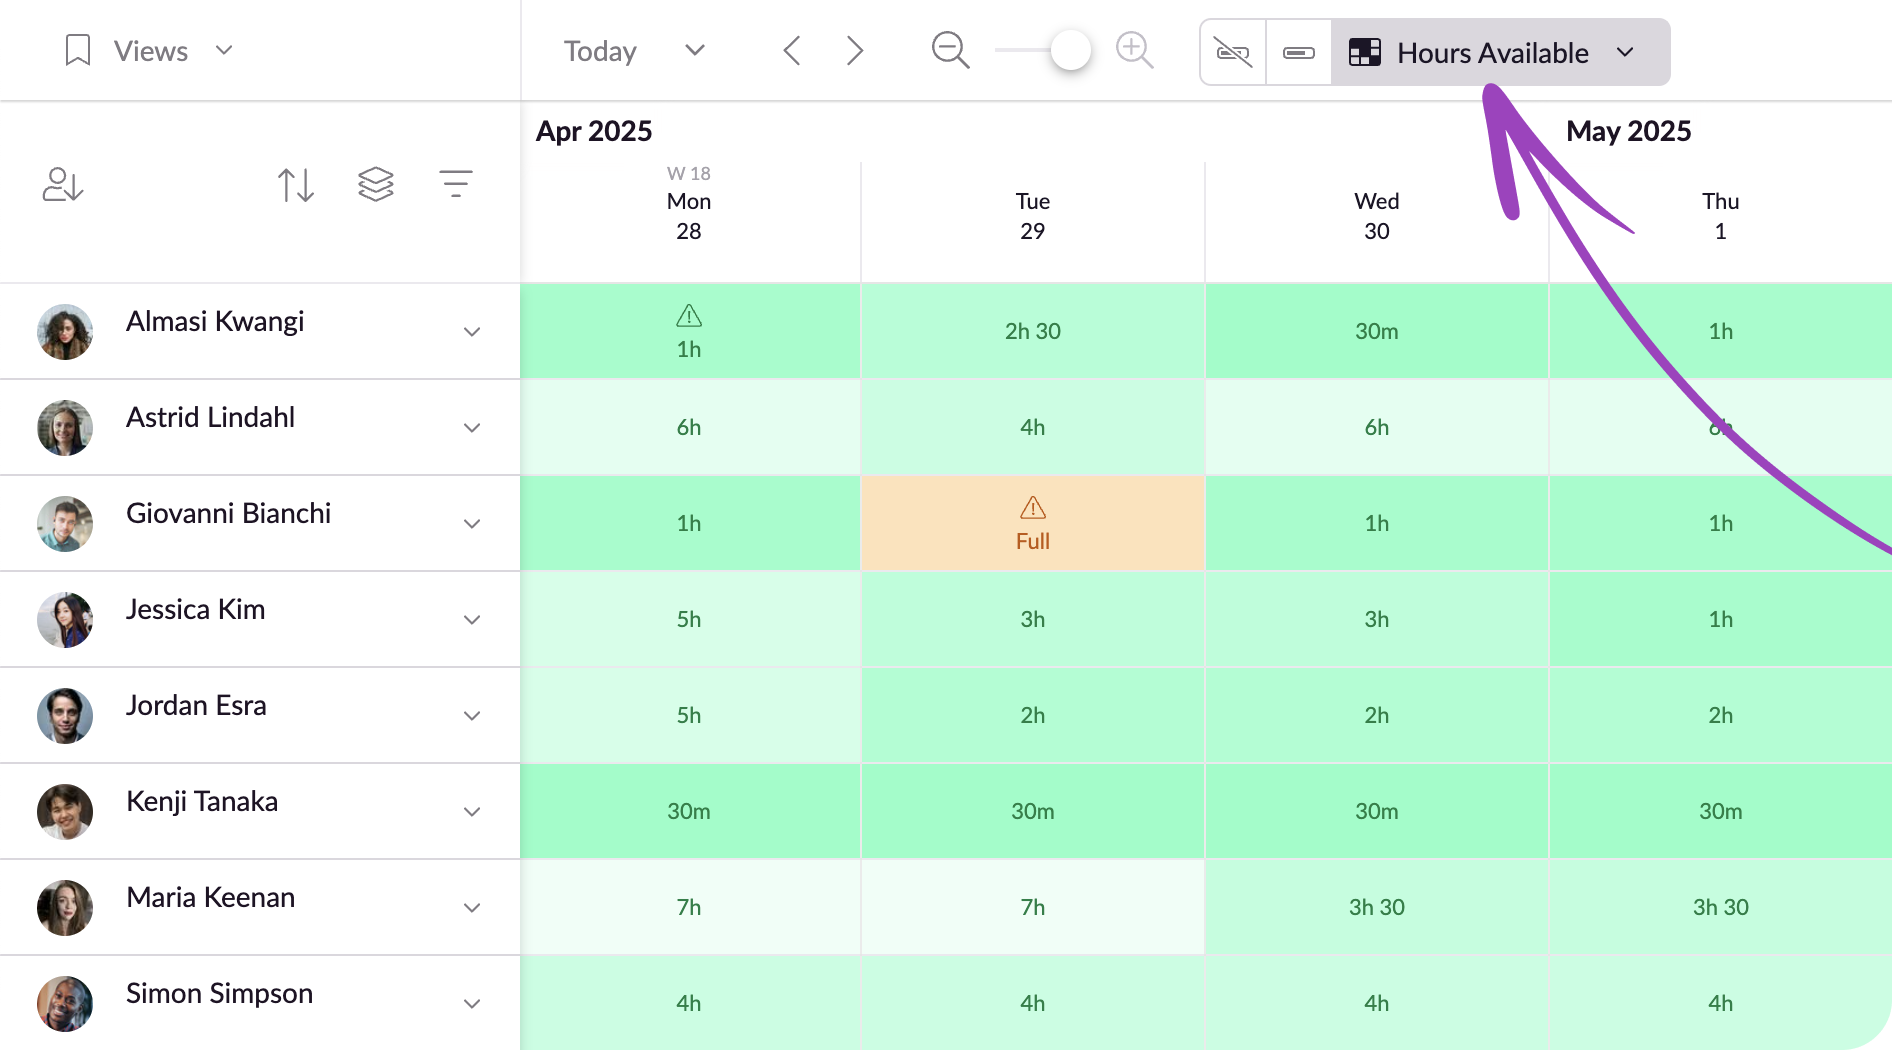
This view shows you exactly how much time people have available for new bookings. With it, you can get a clear picture of who can take on more tasks, and when.
The Availability Bar lets you see how many hours people have left available in a day, but this heatmap view takes visibility one step further.
The hours available view demystifies who can take on specific projects and bookings, and how much time they can spend on them. Ultimately, this lets you plan ahead, on the double.
Like the total utilization view, it also flags when people have full (or more-than-full) schedules, letting you spot overbooking in a flash and solve the issue, before your team gets overwhelmed. This helps keep staff happy and projects on track.
More about heatmap views
Heatmap views are available on Blackbelt and Master plans. Get a step-by-step guide to setting them up in our Help Center.
Explore upcoming releases that’ll supercharge your scheduling even more—including resource placeholders—in our Product Portal:
Explore our product portal to see what’s planned next and what we’ve already added. Vote on which features are most important to you and submit new ideas to have your say!What’s next for Resource Guru?


